
Page 29 - September/October Outdoor Oklahoma Magazine
P. 29
Impressive harvest statistics from the 2021- Management Areas (WMAs) and other pub-
22 hunting seasons again prove that now is lic lands removed. In terms of deer taken, the
a great time to be an Oklahoma big game top three counties last year were Pittsburg with
hunter. Healthy herds and good conditions 4,071 deer harvested;
Figure 2: Success Rates by Method from 2004-Current
led to 117,629 deer being taken, making it Osage County with
the third-highest harvest total on record. 4,055; and McCurtain
Gun Archery Muzzleloader
Antlerless deer harvest accounted for 41 per- County with 2,842. 45
cent of the total, which falls right in line with WMAs and other 40
the statewide annual goal of between 40 and Wildlife Department- 35
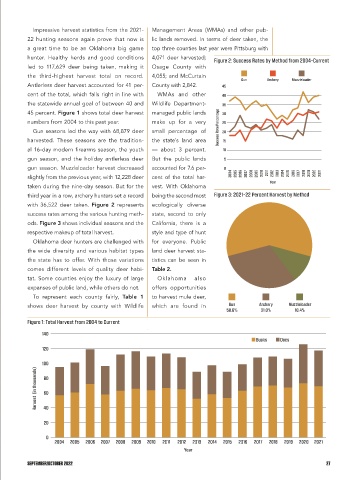
45 percent. Figure 1 shows total deer harvest managed public lands 30
numbers from 2004 to this past year. make up for a very 25
Gun seasons led the way with 68,879 deer small percentage of Success Rate Percentage 20
harvested. These seasons are the tradition- the state’s land area 15
al 16-day modern firearms season, the youth — about 3 percent. 10
gun season, and the holiday antlerless deer But the public lands 5
gun season. Muzzleloader harvest decreased accounted for 7.6 per- 0
slightly from the previous year, with 12,228 deer cent of the total har- 2004 2005 2006 2007 2008 2009 2010 2011 2012 2013 2014 2015 2016 2017 2018 2019 2020 2021
Year
taken during the nine-day season. But for the vest. With Oklahoma
third year in a row, archery hunters set a record being the second most Figure 3: 2021-22 Percent Harvest by Method
with 36,522 deer taken. Figure 2 represents ecologically diverse
success rates among the various hunting meth- state, second to only
ods. Figure 3 shows individual seasons and the California, there is a
respective makeup of total harvest. style and type of hunt
Oklahoma deer hunters are challenged with for everyone. Public
the wide diversity and various habitat types land deer harvest sta-
the state has to offer. With those variations tistics can be seen in
comes different levels of quality deer habi- Table 2.
tat. Some counties enjoy the luxury of large Oklahoma also
expanses of public land, while others do not. offers opportunities
To represent each county fairly, Table 1 to harvest mule deer,
shows deer harvest by county with Wildlife which are found in Gun Archery Muzzleloader
58.6% 31.0% 10.4%
Figure 1: Total Harvest from 2004 to Current
140
Bucks Does
120
100
Harvest (in thousands) 80
60
40
20
0
2004 2005 2006 2007 2008 2009 2010 2011 2012 2013 2014 2015 2016 2017 2018 2019 2020 2021
Year
SEPTEMBER/OCTOBER 2022 27