
Page 20 - Interp Book
P. 20
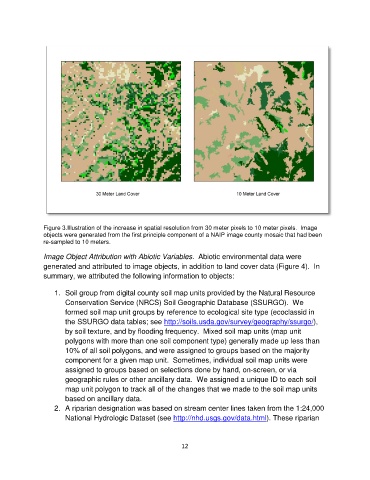
Figure 3.Illustration of the increase in spatial resolution from 30 meter pixels to 10 meter pixels.  Image
               objects were generated from the first principle component of a NAIP image county mosaic that had been
               re-sampled to 10 meters.

               Image Object Attribution with Abiotic Variables.  Abiotic environmental data were
               generated and attributed to image objects, in addition to land cover data (Figure 4).  In
               summary, we attributed the following information to objects:

                   1.  Soil group from digital county soil map units provided by the Natural Resource
                       Conservation Service (NRCS) Soil Geographic Database (SSURGO).  We
                       formed soil map unit groups by reference to ecological site type (ecoclassid in
                       the SSURGO data tables; see http://soils.usda.gov/survey/geography/ssurgo/),
                       by soil texture, and by flooding frequency.  Mixed soil map units (map unit
                       polygons with more than one soil component type) generally made up less than
                       10% of all soil polygons, and were assigned to groups based on the majority
                       component for a given map unit.  Sometimes, individual soil map units were
                       assigned to groups based on selections done by hand, on-screen, or via
                       geographic rules or other ancillary data.  We assigned a unique ID to each soil
                       map unit polygon to track all of the changes that we made to the soil map units
                       based on ancillary data.
                   2.  A riparian designation was based on stream center lines taken from the 1:24,000
                       National Hydrologic Dataset (see http://nhd.usgs.gov/data.html). These riparian


                                                             12